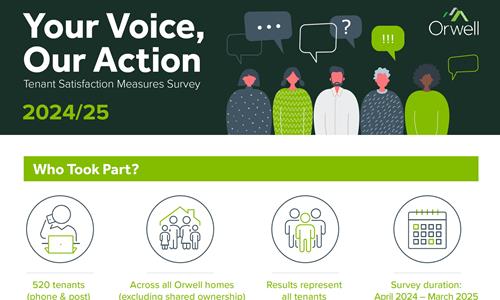
Tenant Satisfaction Measures
These figures are collected from 1st April each year and are updated on a quarterly basis.
Quarter 1 2024/2025 - 74.6%
Quarter 2 2024/2025 - 62.9%
Quarter 3 2024/2025 - 67.7%
Quarter 4 2024/2025 - 70.9%
Quarter 1 2024/2025 - 71.6%
Quarter 2 2024/2025 - 69.1%
Quarter 3 2024/2025 - 66.7%
Quarter 4 2024/2025 - 75.8%
Quarter 1 2024/2025 - 68.5%
Quarter 2 2024/2025 - 61.7%
Quarter 3 2024/2025 - 53.4%
Quarter 4 2024/2025 - 69.5%
Quarter 1 2024/2025 - 76.9%
Quarter 2 2024/2025 - 74.4%
Quarter 3 2024/2025 - 75.8%
Quarter 4 2024/2025 - 77.0%
Quarter 1 2024/2025 - 84.7%
Quarter 2 2024/2025 - 87.0%
Quarter 3 2024/2025 - 84.2%
Quarter 4 2024/2025 - 83.0%
Quarter 1 2024/2025 - 67.5%
Quarter 2 2024/2025 - 59.6%
Quarter 3 2024/2025 - 71.4%
Quarter 4 2024/2025 - 65.0%
Quarter 1 2024/2025 - 78.0%
Quarter 2 2024/2025 - 68.1%
Quarter 3 2024/2025 - 86.3%
Quarter 4 2024/2025 - 69.7%
Quarter 1 2024/2025 - 81.4%
Quarter 2 2024/2025 - 75.4%
Quarter 3 2024/2025 - 82.6%
Quarter 4 2024/2025 - 78.9%
Quarter 1 2024/2025 - 40.6%
Quarter 2 2024/2025 - 28.1%
Quarter 3 2024/2025 - 39.4%
Quarter 4 2024/2025 - 33.3%
Quarter 1 2024/2025 - 80.2%
Quarter 2 2024/2025 - 50.7%
Quarter 3 2024/2025 - 73.4%
Quarter 4 2024/2025 - 69.8%
Quarter 1 2024/2025 - 71.1%
Quarter 2 2024/2025 - 56.0%
Quarter 3 2024/2025 - 72.6%
Quarter 4 2024/2025 - 65.8%
Quarter 1 2024/2025 - 67.8%
Quarter 2 2024/2025 - 66.2%
Quarter 3 2024/2025 - 74.4%
Quarter 4 2024/2025 - 57.3%
Management Information Measures
These figures are collected from 1st April each year and are updated on an annual basis.
These measures only provide performance information for Low Cost Rental Accommodation (LCRA) dwellings (Housing and Regeneration Act 2008 - Explanatory Notes (legislation.gov.uk)). Therefore, results may differ from figures published elsewhere.
Complaints received per 1,000 homes
52.2
Stage 1 complaints received
Complaints received per 1,000 homes
13.5
Stage 2 complaints received
96
%
Stage 1 complaints responded to within set timescales
96.1
%
Stage 2 complaints responded to within set timescales
ASB cases opened per 1,000 homes
5.8
Anti social behaviour cases opened
ASB cases opened per 1,000 homes
0
Anti social behaviour cases opened that involve hate
0.2
%
Homes that do not meet the Decent Homes Standard
Non emergency repairs completed to timescale
| Urgent repair timescale | 7 days |
| Non-Urgent repair timescale | 31 days |
| Awaab Law - 21 days | 21 days |
| Awaab Law - 14 days | 14 days |
| Awaab Law - 7 days | 7 days |
| Responsive Repairs Plus | 12 Months / 260 days approx. |
100
%
Gas safety checks carried out
100
%
Fire risk assessments carried out
95
%
Asbestos management surveys or reinspection's carried out
100
%
Legionella risk assessments carried out
100
%


